

Time to Read: 8 Minutes
In our August 5th article, we noted our decision to move portfolios which were underweight equities back to benchmark weight through rebalancing. We also described our intention to watch market action before making our next tactical move. Since then, we have seen continued improvement in a variety of objective indicators, warranting an additional allocation to equities in some of our core portfolios.
Reliable Breadth Thrust Indicator Flashes “Buy” Signal
Breadth thrusts are technical indicators used to gauge market momentum and can sometimes signal a market bottom. The more breadth thrust indicators showing positive readings, the more confident we are that a short-term bottom has been established.
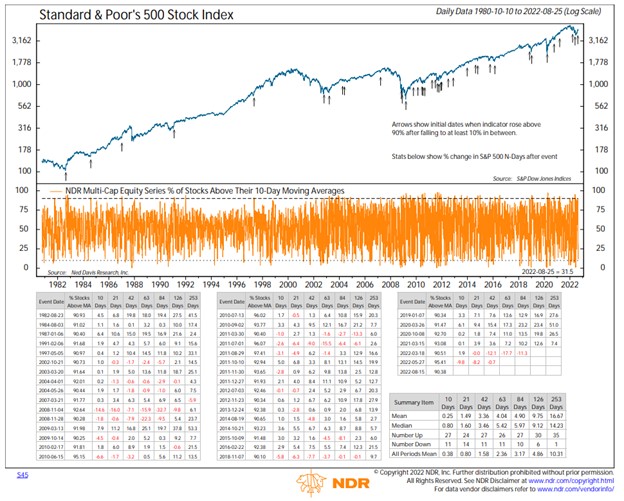
Standard & Poor’s 500 Stock Index
The chart above illustrates what we consider to be a reliable breadth thrust indicator. It represents the percentage of stocks in the Ned Davis Research (NDR) Multi-Cap Institutional Equity Series above their 10-day moving averages. The top portion shows the Standard & Poor’s 500 Stock Index and the bottom table details the percentage of stocks trading above their 10-day moving averages. When more than 90% of the stocks in the multi-cap universe trade above their 10-day moving averages, the indicator creates a “buy” signal, which just occurred on August 15th. The lower right table shows such a signal has happened 36 times since 1980, resulting in an average one-year return of 16.67% and only one down period, illustrating the excellent track record breadth thrust indicators can have in measuring short-term market bottoms.
Don’t Fight the Trend
One of our key rules to investing is “don’t fight the trend.” Rather than trying to predict which way the market will go, we listen to what the market is telling us about supply and demand. The trend has been notably weak since early 2022 but has recently begun to exhibit some encouraging signs.
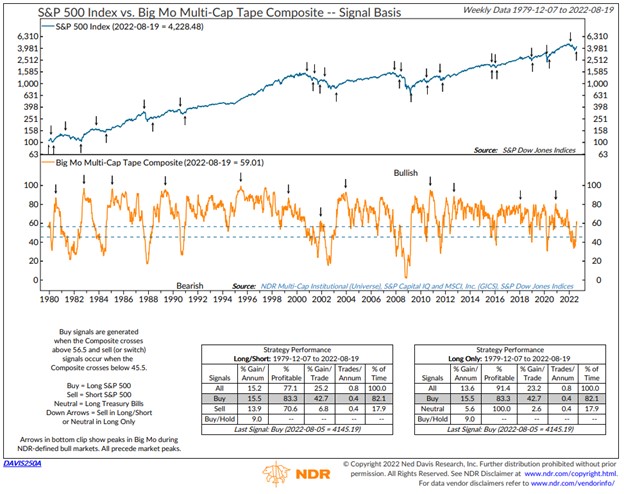
S&P 500 Index vs Big Mo Multi-Cap Tape Composite – Signal Basis
NDR’s flagship momentum indicator, the Big Mo Multi-Cap Tape Composite, just flashed a “buy” signal in the last two weeks, the first since May 2020. The chart above looks at the intermediate-term trend and aggregates the signals of more than 100 components to reflect the generalized health of the market. This indicator has also had an excellent track record of identifying opportunities for tactical portfolio adjustments.
Beware the Crowd at Extremes
At Stratos Private Wealth, we view sentiment as a contrarian indicator. When there is extreme optimism in financial markets and everyone is happy, we believe this is usually a sign of complacency—market weakness often lies ahead. When there is extreme pessimism and people are very nervous, we generally view it as a bullish sign, especially when pessimism hits an extreme then reverses. One intermediate-term measure of sentiment we like to watch is NDR’s Crowd Sentiment Poll, shown below.
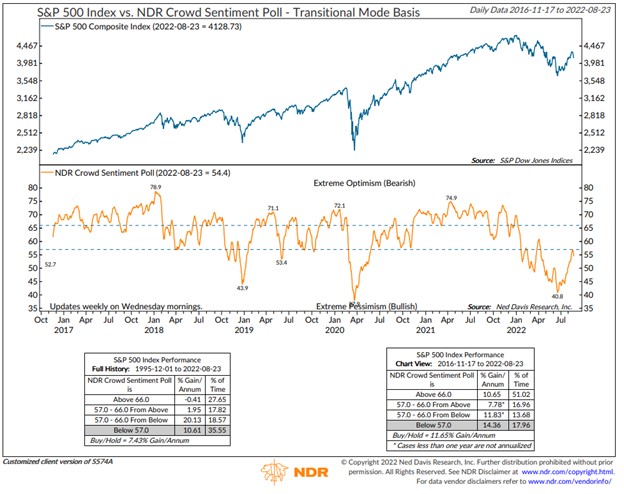
S&P 500 Index vs. NDR Crowd Sentiment Poll – Transitional Mode Basis
The orange line shows extreme pessimism peaked mid-June, coinciding with the most recent bottom in the US stock market. While the indicator has since recovered, it remains in a pessimistic zone that has been historically consistent with above-average market gains.
The Bottom Line
While we are certainly not out of the woods yet, we felt the positive readings from our momentum and sentiment indicators warranted a slight increase in equity in some of our core portfolios exposure. We will continue to monitor these and other objective indicators to see if additional action should be taken. If there is a deterioration in momentum and market action, we will likely reverse direction and trim back equities. However, if we see continued improvement and/or action to signal a more supportive Federal Reserve and inflation picture, we will look to further increase our equity exposure in some of our core portfolios.
.png?width=290&name=Favicon%20SPW%20(1).png)