

Time to Read: 7 Minutes
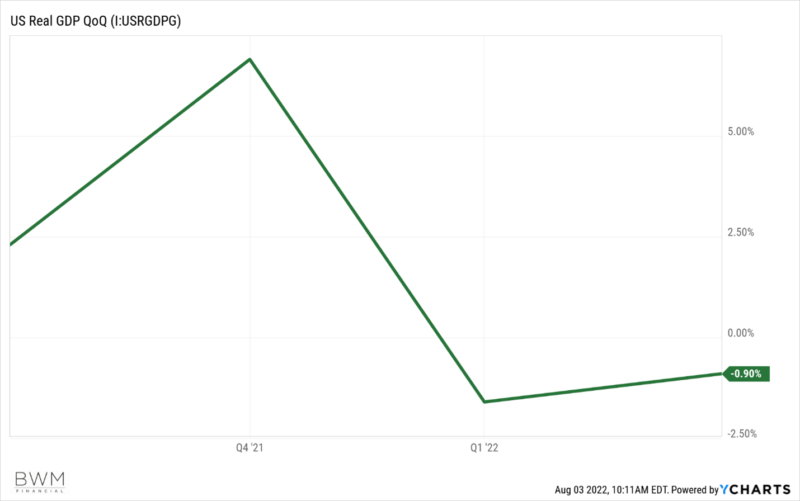
On July 28, the advance estimate released by the Bureau of Economic Analysis showed US gross domestic product (GDP) fell at an annual rate of 0.9% in Q2 2022. This follows a 1.6% decline in Q1 2022, as shown below.
Given the two consecutive quarters of negative GDP, investors are asking, “Are we in a recession?” The answer is, “We just don’t know.” One widely held view is that two consecutive negative GDP reports can be considered a recession. Officially, the National Bureau of Economic Research (NBER) Business Cycle Dating Committee is in charge of declaring recessions and expansions. However, the committee’s approach to determining the dates of turning points is retrospective, and it usually waits to identify a recession for a period of time after it starts.
Here we explore alternate views on the recession debate and discuss the implications for our portfolios.
Gross Domestic Product vs. Gross Domestic Income
The NBER has called a recession after two quarters of negative GDP growth every single time since World War 2. One counterpoint, though, is that you cannot have a recession with employment and income as strong as they are today.
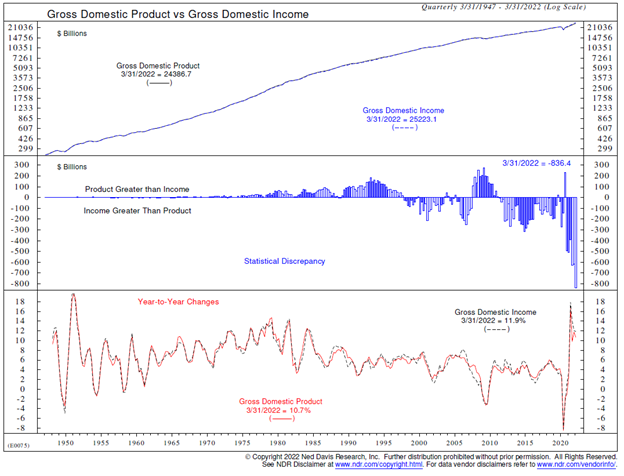
The differentiation comes down to the basic economic concept that one person’s spending is another person’s income. Gross domestic product (GDP) calculates spending, while gross domestic income (GDI) sums income and profits. Theoretically, the two should be equivalent—but they diverge sometimes, until years of revisions have been processed.
In Q1 2022, GDP contracted at a 1.6% annual rate, while GDI expanded at a 1.8% annual rate. The one-year differentials resulted in a record gap, or statistical discrepancy, between the two series. The chart below shows that, since the pandemic, income has been growing faster than product.
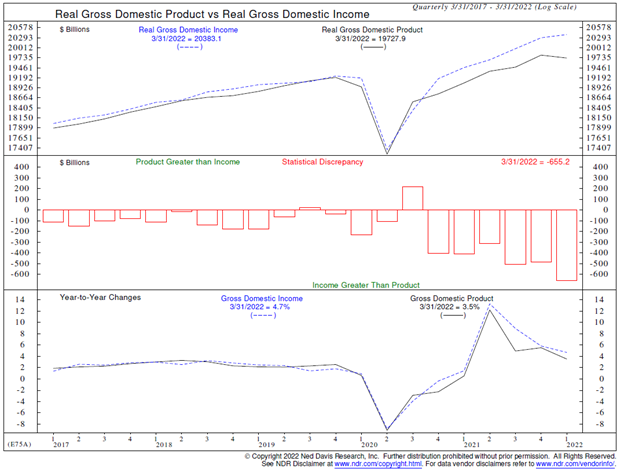
Taking a longer-term view of these data points in the chart below, we see there have been ebbs and flows between the GDP and GDI over time—but the recent discrepancy between the two is noteworthy.
Q2 2022 GDI won’t be available until August 25. We’ll be interested to see if GDI growth turns negative, or if the measure will show economic growth.
Does a Recession Call Matter?
Now that we have the economics lesson out of the way, the question becomes, “Does a recession call even matter?” We think it might. The stock market is a leading economic indicator. Using the Dow Jones Industrial Average, the median lead time from the start of a bear market to the start of a recession in the post-war era has been 5.5 months, ranging from as short as zero to as many as 16 months, as shown below. The median lead time from the end of the bear market to the end of the recession has been 3.5 months, ranging from one month to eight months.
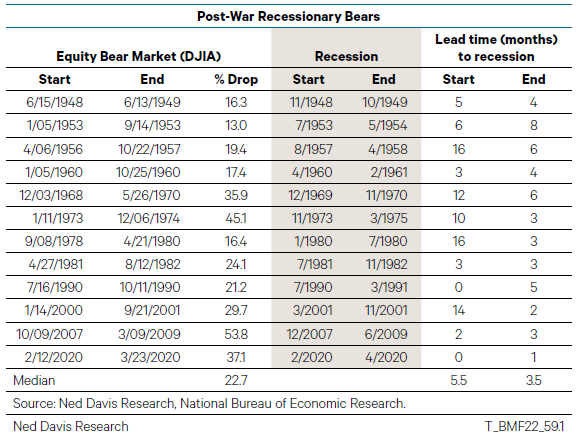
The reason the recession call might matter is because we have never seen a bear market in stocks end before the recession began, going all the way back to 1900. Since recessions are only known in hindsight, we have four possible outcomes in our current situation:
- The recession has already begun, and the stock market may have bottomed in June.
- The recession has not started yet, and the stock market could make a new low.
- The Fed will engineer a soft landing, so the bear market may have ended last month.
- This time is different—the bear market is over before the recession has begun.
So, if the recession has not started yet and the Fed doesn’t engineer a soft landing, either it will be different this time and we already hit a new low, or there could be more tough times ahead.
What To Do Now?
Whenever markets fall into bear territory, we believe investors can use the opportunity to make certain strategic portfolio moves, such as rebalancing and tax-loss harvesting.
In terms of tactical portfolio positioning, Stratos Private Wealth relies on objective indicators to look through the noise and determine the best course of action based on a “weight of the evidence” approach. In our latest webinar, we identified one such key indicator as breadth thrust. This technical indicator gauges market momentum that can sometimes signal a market bottom.
The chart below measures the ratio of stocks that have advanced over the last 10 days vs. declined. It triggers a “buy” signal when the ratio moves higher than 1.9, as it did last week. Looking at the summary table and focusing on the 252 trading days after the signal (representing one calendar year), we see this signal has occurred 53 times since 1940, with 52 positive returns and 1 negative return. The mean return was greater than 17%.
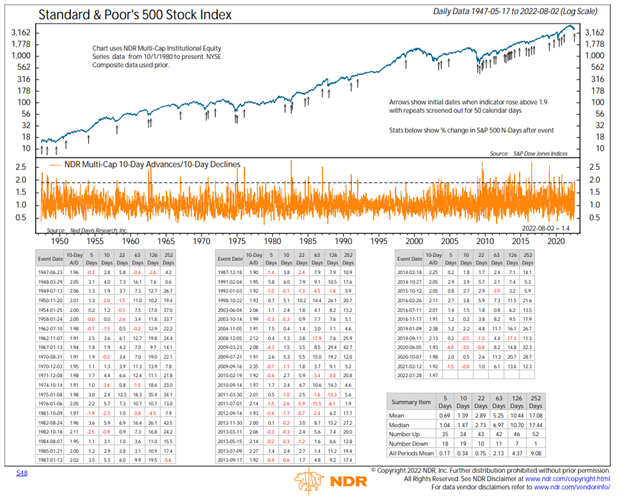
There is no guarantee that past performance will equal future results, and shorter-term returns following the signal are more nuanced. As such, we will be looking for further confirmation before making aggressive portfolio changes. For now, Stratos Private Wealth will be looking to move the tactical portfolios that are underweight equites back to benchmark weight through rebalancing. In addition, we will be taking advantage of the recent rise in yields to slightly increase our exposure to bonds.
These small changes leave us close to our benchmark allocations across most portfolios. If economic growth and market action becomes clearer and more positive, we will evaluate taking an overweight position in equities in the coming months. Should the contrary become more apparent, we will re-evaluate our positioning in line with the weight of the evidence.
.png?width=290&name=Favicon%20SPW%20(1).png)