
%20(1).png?width=300&name=Cover%20Size%20Template%20(blog,%20webinars,%20headers)%20(1).png)
Are we due for a correction?
There’s been no shortage of good news for equity investors recently. With US equities setting new highs against a backdrop of resilient economic growth, easing inflation, and an increasingly dovish Federal Reserve, investors have many reasons to celebrate. The S&P 500 is up nearly 40% since the start of 2023. The NASDAQ 100, almost unbelievably, is up nearly 70% over that time.
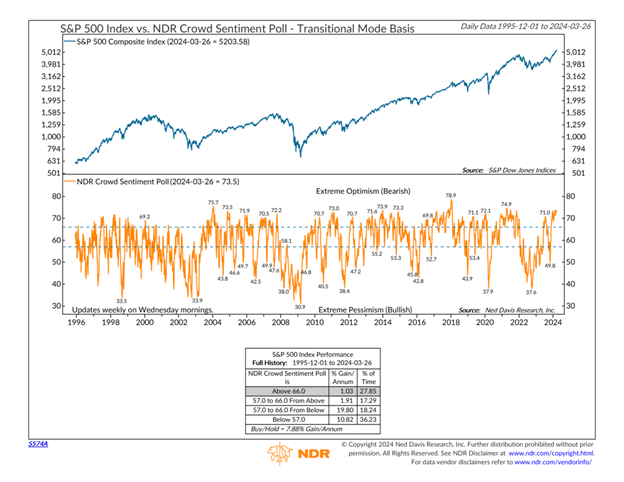
But all that good news has investors asking if it’s too much of a good thing. When will this rally end, and will it end with a crash? Investors know from experience that an exuberant stock market could mean lower future returns. In fact, one of the core tenets of our investment philosophy is to beware the crowd at extremes. In other words, the more bulls, the more reasons to be concerned. As we can see in NDR’s Crowd Sentiment Poll below, there are a lot of bulls right now, pushing sentiment into an overly-optimistic zone that has historically meant low equity returns.
Will the rally continue?
Sentiment aside, investor concerns about an aging rally aren’t unfounded. A healthy stock market experiences corrections regularly and, by some metrics, we’re overdue for a pullback. A 5% correction in the S&P 500 is commonplace, occurring on average every 51 trading days, but it’s been 100 days since the last 5% correction, as illustrated below.
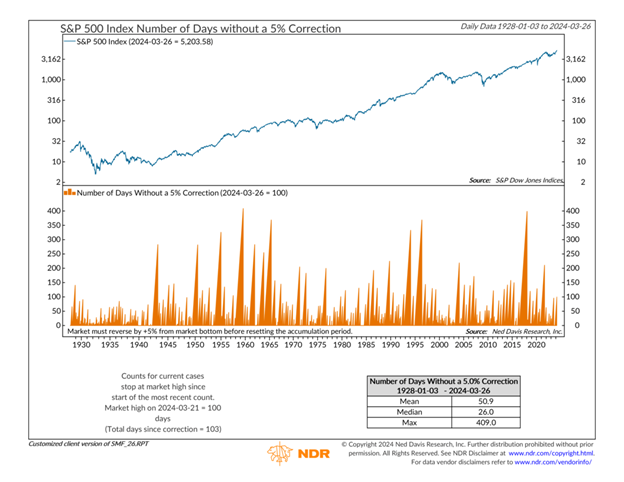
Time to sell? Not so fast. While 100 days is nearly double the average, the S&P 500 has run as long as 409 days without a 5% correction.
But most investors aren’t too concerned with a run-of-the-mill 5% correction. After all, they occur almost every other month, on average. Investors understand the risk of a 5% drawdown every two months is simply part of owning risk assets. Threat of a 10% or 20% correction, on the other hand, is more concerning to investors. The good news: Those larger corrections are far less common, and it doesn’t look like the current rally is below the average number of days between 10% and 20% corrections.
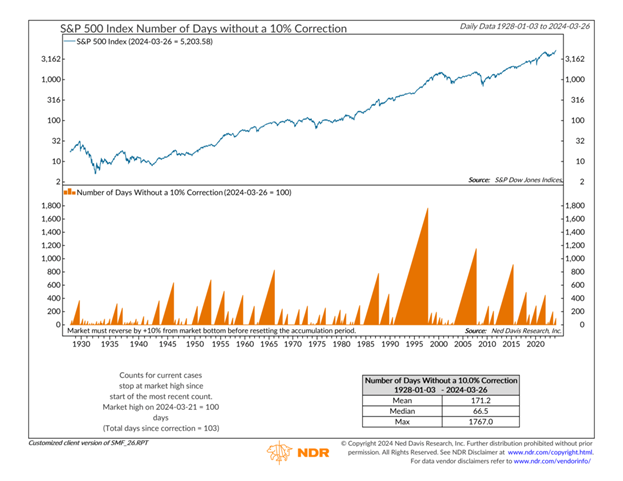
At 100 days since the last 10% correction, we’re a few months short of the average of 171 days. Moreover, we’ve seen rallies uninterrupted by a 10% correction run as long as 1,767 days, as shown below.
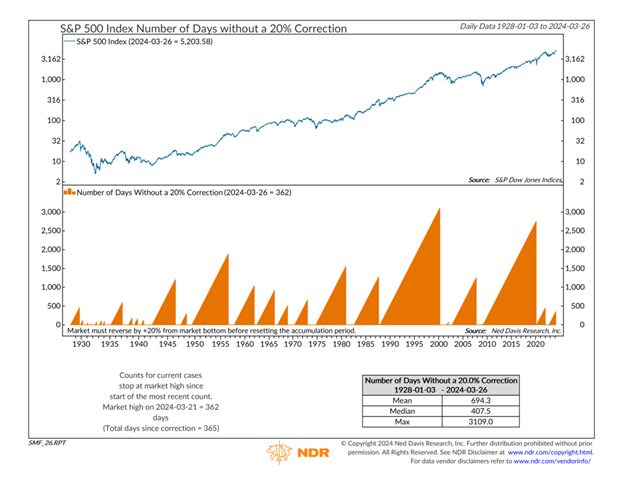
20% corrections are even less frequent. The last one was 362 days ago, as seen on the chart below, giving the market plenty of room to run before we approach the 694 day average or 3,109 day historical maximum.
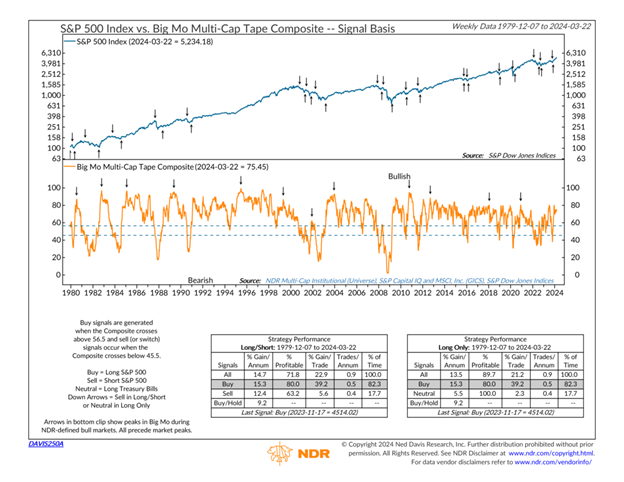
While a 5% drawdown in the near term shouldn’t be a surprise, we’re far from overdue for a more significant 10% or 20% correction. Giving us confidence in a continued equity rally are market trends and momentum. NDR’s flagship “Big Mo” indicator, a measure of the market’s technical health, has been on a bullish buy signal since November, as shown below. The S&P 500 has grown 15.3% on average while the indicator is in this zone.
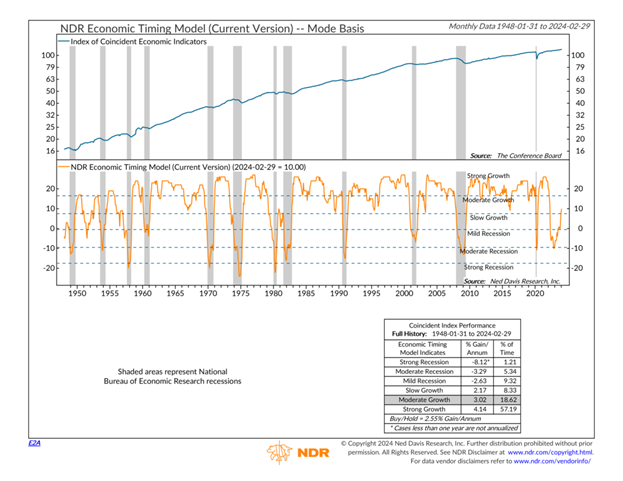
The market has been supported by a resilient, healthy economy. NDR’s economic timing model consists of 27 economic indicators and interprets those readings as a guide for future economic growth. As shown below, the model and its underlying indicators have been improving from the recession-indicative level at the end of 2022 and, as of today, the model indicates a moderately growing economy, despite all the calls for a potential recession.
Right now: Weight of the evidence leans bullish
If we see market or economic health deteriorate while sentiment remains high, we would have reason to become more bearish. We are cognizant of the length and magnitude of this rally and are keeping a pulse on sentiment. At the moment, economic resiliency and market health cause the weight of the evidence to lean bullish. As always, we remain focused on emerging risks and will adjust our strategies accordingly.
Third party sources and supporting documentation owned and provided by Ned Davis Research
Stratos Private Wealth is a division through which Stratos Wealth Partners, Ltd. markets wealth management services. Investment advisory services offered through Stratos Wealth Partners, Ltd., a registered investment adviser. Stratos Wealth Partners and its affiliates do not provide tax, legal, or accounting advice. This material has been prepared for informational purposes only; and is not intended to provide, and should not be relied on for, tax, legal, or accounting advice. You should consult your own tax, legal, and accounting advisors before engaging in any transaction. Content in this material is for general information only and not intended to provide specific advice or recommendations for any individual. To determine which strategies or investments may be suitable for you, consult the appropriate qualified professional prior to making a decision. Investing involves risk including possible loss of principal. Some of the information contained herein has been obtained from third party sources which are reasonably believed to be reliable, but we cannot guarantee its accuracy or completeness. The information should not be regarded as a complete analysis of the subjects discussed.
.png?width=290&name=Website%20Asset-%20Allie%20(6).png)