Market Due For a Minor Pullback
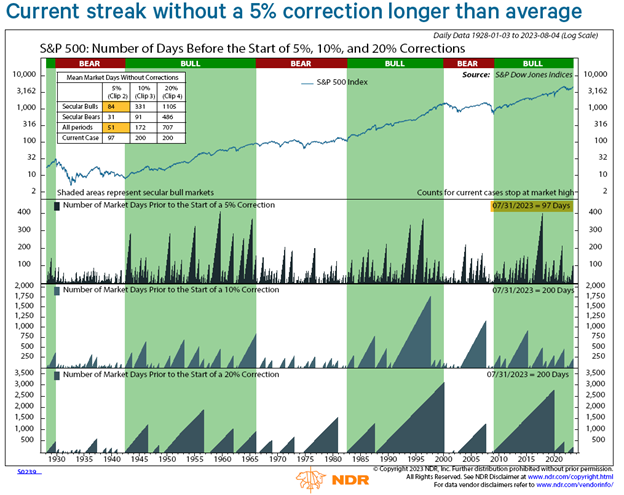
The S&P 500 Index closed at 4,370.36 on August 17th, 4.76% below the close on July 31st. This drawdown interrupts what has been a spectacular year for equity investors, with the S&P 500 rising more than 20% since the start of the year through July 31st. In observing past market rallies, this drawdown is normal and, to some degree, expected. Leading up to the July 31st peak, investors enjoyed 97 days since the S&P 500 experienced a correction of at least 5%, as shown below. That winning streak is uncharacteristically long when compared to an average of 51 days between 5% corrections. Moreover, the rally seemed to be aging even when compared to an average of 84 days between corrections during secular bull markets.

With the rally aging and the S&P 500 approaching a 5% correction, should investors start to worry? Not necessarily. Investors have enjoyed market rallies ranging from a single day—seen during the early days of COVID—to a 409-day win streak that ended in August 1959. So, simply exceeding the length of the average rally doesn’t warrant panic. In fact, our asset allocation models currently maintain an overweight equity stance based on our objective indicators and weight-of-the-evidence approach.
Key Indicator Points to Favorable Relief of Excess Optimism
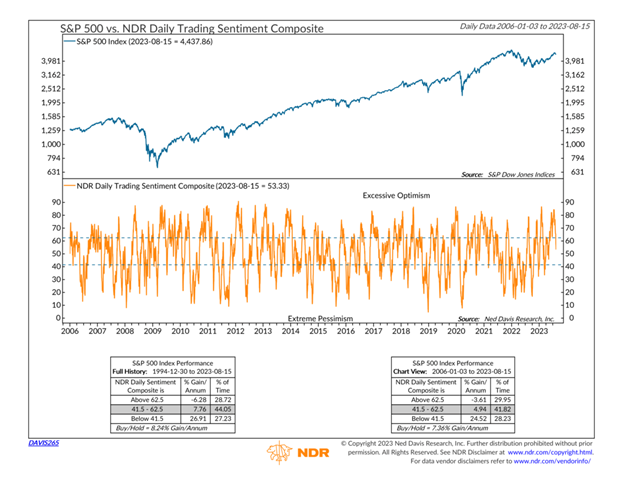
Along with the current drawdown, we have observed a weakening of market sentiment. After climbing into overly optimistic territory, short-term sentiment swiftly retracted to a neutral level in just a few days, as shown below. We view short-term sentiment as a contrarian indicator: When market participants become overly optimistic, it tends to mean worse returns for stocks. As such, the recent pullback in the S&P 500 represents a return to neutral levels of market sentiment and improves our outlook for future performance.

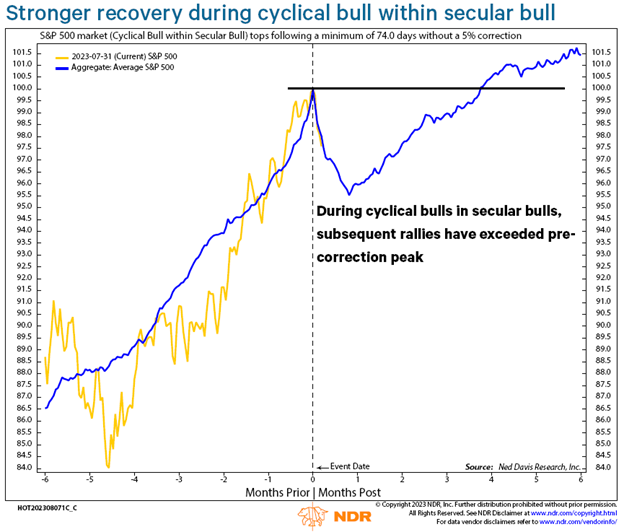
With that in mind, the current price decline seems to be a relief of excess optimism rather than an indication of more substantial damage to the market. Within the context of a prolonged rally, the market typically reverses course and continues rising after a 5% correction. In the case of corrections within a bull market, the ensuing rally tends to push the market above the previous peak within a few months, as illustrated below.

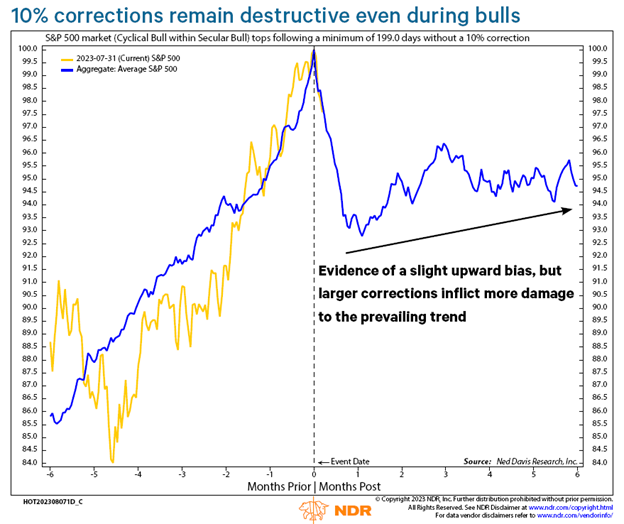
It's not all good news, however. While a 5% correction is typically followed by a rapid recovery, a 10% correction tends to have a more pronounced negative impact on future returns. As shown in the chart below, the S&P 500 trends upward following a 10% correction but doesn’t rebound as quickly or to the same extent as it does following a 5% correction. While this isn’t as rosy a scenario, we should be careful to remember that this chart represents just 6 months of returns following the correction. Time will tell whether the current pullback extends to 10% or if we enjoy a continued rally from here.

Overweight Equities, Continually Monitoring Conditions
Of course, there are several factors influencing market movement, and several questions that remain unanswered. Is the Fed done hiking? Is inflation under control? Can the economy handle a higher-for-longer rate environment without slipping into a recession?
As investors, we are compensated for taking risk and should remain mindful that pullbacks, while uncomfortable in the moment, are an inherent reality of investing. At Stratos Private Wealth, we continue to rely on our objective rules and indicators to steer our asset allocation strategy as the answers to these questions emerge.
Bottom Line
For now, our tactical models remain overweight equities and cash and underweight bonds, based on our weight-of-the-evidence approach. As always, we are prepared to respond if circumstances change. We encourage clients to stay tuned for our upcoming webinars and market commentary and reach out to your advisors if you would like to discuss your individual situation.
Stratos Private Wealth is a division through which Stratos Wealth Partners, Ltd. markets wealth management services. Investment advisory services offered through Stratos Wealth Partners, Ltd., a registered investment adviser. Stratos Wealth Partners and its affiliates do not provide tax, legal, or accounting advice. This material has been prepared for informational purposes only; and is not intended to provide, and should not be relied on for, tax, legal, or accounting advice. You should consult your own tax, legal, and accounting advisors before engaging in any transaction. Content in this material is for general information only and not intended to provide specific advice or recommendations for any individual. To determine which strategies or investments may be suitable for you, consult the appropriate qualified professional prior to making a decision. Investing involves risk including possible loss of principal. Some of the information contained herein has been obtained from third party sources which are reasonably believed to be reliable, but we cannot guarantee its accuracy or completeness. The information should not be regarded as a complete analysis of the subjects discussed.
.png?width=290&name=Website%20Asset-%20Allie%20(6).png)

.png?width=300&name=Blog%20Cover-%20Market%20Pullback%20(1).png)