
%20(1).png?width=300&name=Featured%20Image%20(2000%20%C3%97%201260%20px)%20(1).png)
Increasing Equities and Cash
Based on improvements in our models and indicators, we have made a strategic adjustment to our recommended investment allocation for tactical portfolios at Stratos Private Wealth (SPW). We increased (again) our weightings to global equities, taking us to maximum overweight. In addition, we increased our allocation to what we consider cash equivalents through the use of short-term T-bills. Both come at the expense of traditional fixed income.
From an indicator perspective, we have observed two important developments. First, the narrow market trends present after the Silicon Valley Bank bankruptcy have now broadened. Second, the risk of an economic recession has been pushed further into the future. These factors influenced our decision to revise the asset allocation to optimize potential returns and manage risks effectively.
Improving Market Breadth
At SPW, we constantly review and refer to market breadth. Market breadth describes the overall health and strength of the stock market. It provides insights into the level of participation and involvement of various stocks or securities in a market trend. Essentially, it measures the extent to which a particular market movement is supported by a wide range of individual stocks—or if the move is more concentrated in a few select stocks.
When market breadth is narrow, a limited number of stocks drives the overall market performance. This can indicate a lack of broad-based participation and may suggest that the market movement is dependent on only a handful of influential stocks. Conversely, when market breadth is broad, a larger number of stocks across different sectors or industries are participating in the market trend. This suggests a healthier and more sustainable market environment.
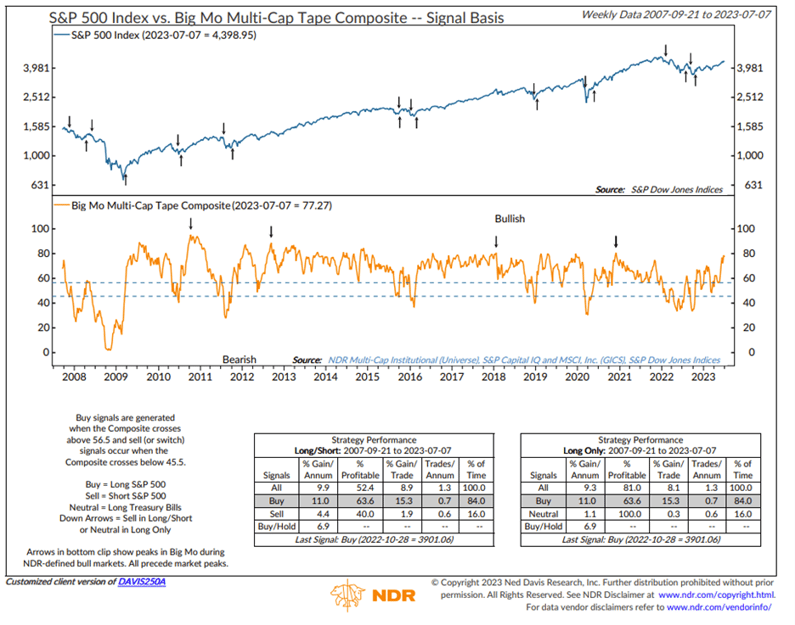
While we refer to a wide range of indicators to track market breadth, a particularly important one is the Big Mo Multi-Cap Tape Composite from Ned Davis Research (NDR), shown below. The Big Mo Tape measures the percentage of sub-industries of the US stock market currently experiencing positive trends. It helps us assess the overall health and strength of the market over a longer period of time. Typically, it takes a few months after a significant decline in the market for the Big Mo Tape to reach very high levels, indicating strong positive momentum in the market.
Currently, the Big Mo Tape is reading 78.64%, the highest level since December 2020, which preceded a sustained market advance. When the reading is above 56% (a buy signal that flashed in October 2022) and showing an upward trend compared to six weeks ago, it is considered a positive signal for our model.
In addition to increasing overall equity exposure, we also adjusted our holdings in US equities to include greater exposure to an equal-weighted version of the S&P 500 index. Traditional indices like the S&P 500, the Dow Jones Industrial Average or the NASDAQ 100 are capitalization-weighted indices. In a capitalization-weighted index, companies with larger market capitalizations have a greater influence on the index's performance compared to smaller companies. As such, the index gives more weight or importance to the larger companies in terms of their impact on the overall index value.
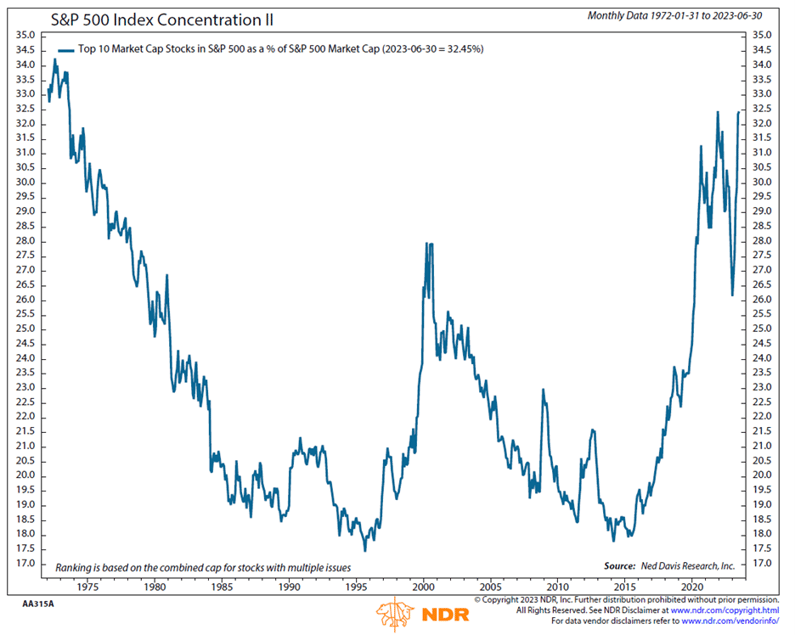
Despite the broadening of the equity rally this year, the concentration among the top 10 stocks in the S&P 500 are close to the largest percentage since the mid-1970s, as shown below. One might ask, “How can this be, if the breadth of the market is improving?” The answer is that the other 490 stocks are also rising, just at a slower rate. If the market continues to broaden, we believe a less concentrated index might allow opportunity for outperformance as the laggards play “catch up” to the top 10 stocks.
Recession Risk Pushed Out
For months, we’ve heard calls for an imminent recession in the US in 2023. At SPW, we stated a year ago that we were likely already in some form of recession, depending upon the industry you were considering. We had two consecutive quarters of negative GDP growth, which had historically happened every time a recession has been called—but many economists and pundits said it was different in 2022 due to the strong job market.
While the Federal Reserve (Fed) has continued to move rates higher this year, the economy has actually improved in some areas and the calls for a 2023 recession keep getting pushed out. As we use objective indicators here at SPW, we believe it might take some time before a recession materializes, and a soft landing for the economy is still possible.
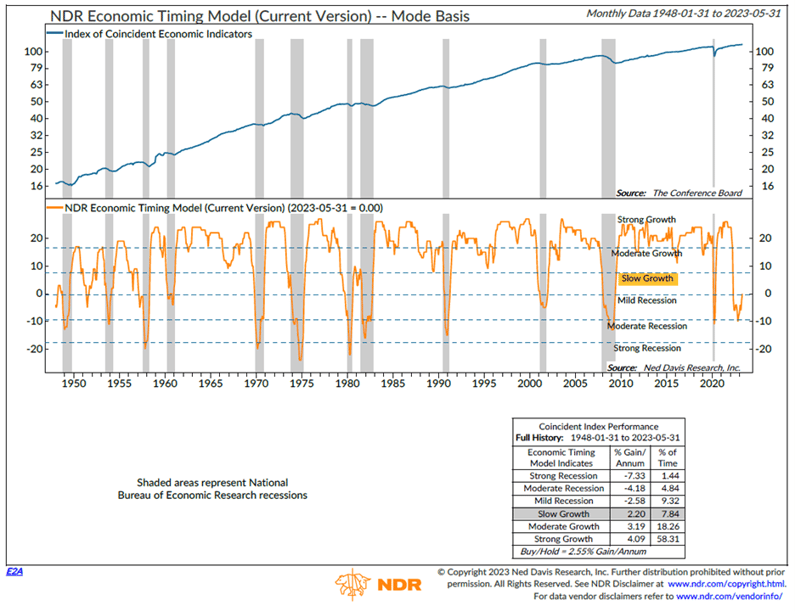
One reason underpinning our viewpoint: Economic indicators have been coming in better than expected. One model we watch closely is NDR’s Economic Timing Model, featured below. It consists of 27 different economic indicators—each monitoring a different sector of the economy—and rates that sector's monthly performance with a positive or a negative signal.
As the lower clip of the chart illustrates, the indicator bottomed out in November 2022 (consistent with our thesis above on a “rolling recession”) and has subsequently improved. It recently moved from the Mild Recession zone to the Slow Growth zone.
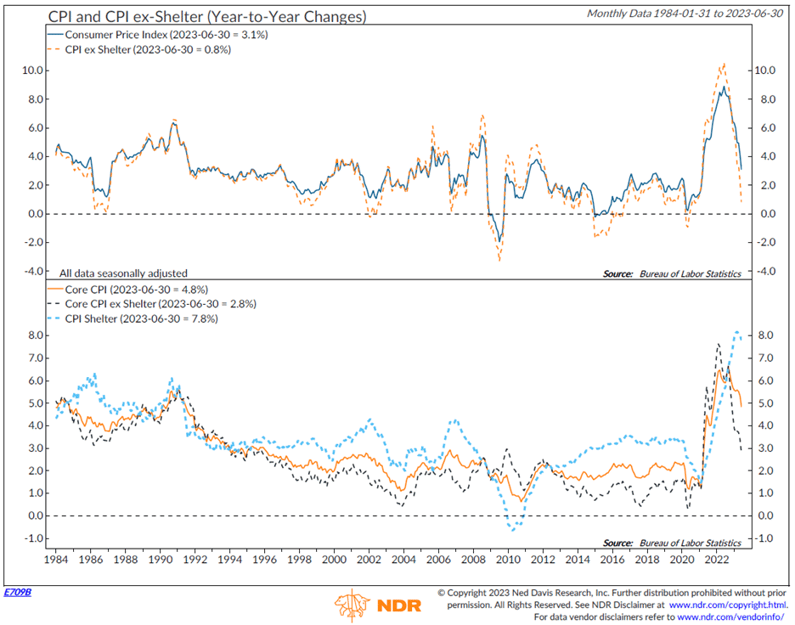
Declining inflation is another reason we believe a potential recession is not imminent. The CPI report released on July 12, 2023 showed continued improvement on the inflation front. As the chart below illustrates, headline CPI eased to 3.0% year-over-year, registering the slowest pace since March 2021 and coming in below the consensus expectation of 3.1%. If shelter is removed from the equation, the number is just 0.8%. At SPW, we have argued that the government’s metrics for measuring shelter are antiquated and slow to respond when compared to more real-time measures. Real-time measures from Zillow and other market participants have been showing easing price pressures for months now.
With inflation potentially cooling, this could allow the Fed to continue to pause its interest rate hiking path—or at least there might be an end in sight to their tightening bias.
Increasing cash equivalents
In our tactical models, we also increased our cash equivalent position at the expense of traditional fixed income. While we discussed the likelihood of a Fed pause above, we don’t see rate cuts coming anytime soon. If a recession doesn’t materialize in the short term, longer-term interest rates (and bond prices) could remain rangebound.
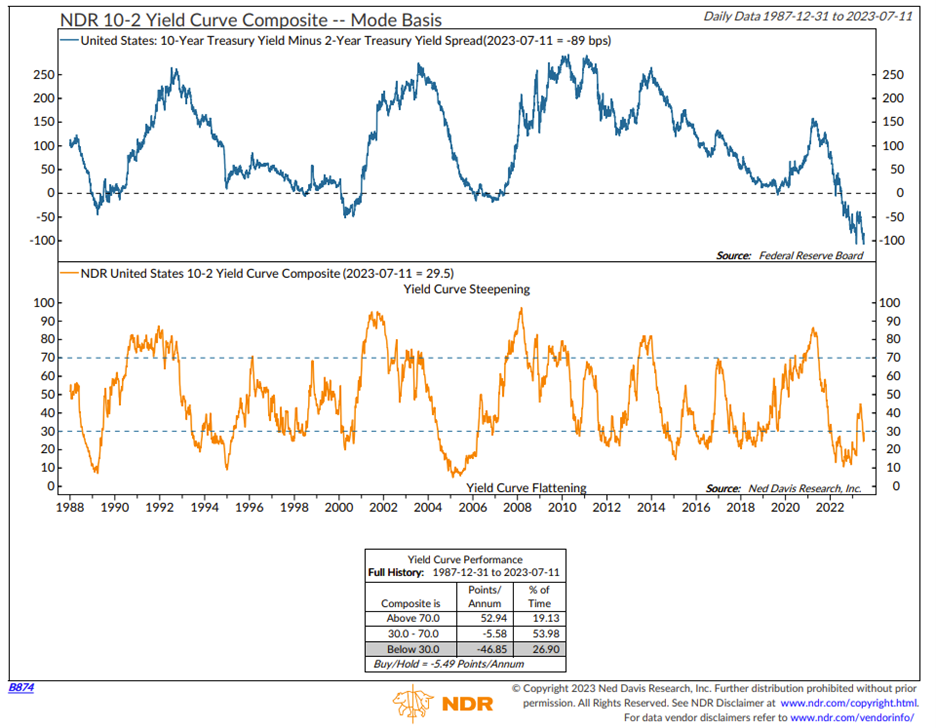
Looking at the chart below, in the top clip we can see the difference between the 10-year Treasury bond yield and the 2-year yield is the most negative it has been since the mid-1980s. This means short-term Treasury bonds are paying higher interest rates than long term bonds by the largest amount in decades.
By increasing our allocation to cash equivalent investments, we expect to collect more interest in the short term while dramatically reducing price sensitivity to interest rates on the reallocated positions.
Bottom line
While we are not out of the woods from a risk perspective, SPW continues to follow a “weight of evidence” approach to investing. We are responding to indicators by increasing our equity and cash positions at the expense of longer-dated fixed income. Improving market breadth, falling inflation, and improving economic conditions all are supporting this reallocation. As we move into the upcoming earnings season, we will see if things continue to cooperate. If our models begin to shift to a less favorable stance, we will promptly take action by adjusting the allocation.
Stratos Private Wealth is a division through which Stratos Wealth Partners, Ltd. markets wealth management services. Investment advisory services offered through Stratos Wealth Partners, Ltd., a registered investment adviser. Stratos Wealth Partners and its affiliates do not provide tax, legal, or accounting advice. This material has been prepared for informational purposes only; and is not intended to provide, and should not be relied on for, tax, legal, or accounting advice. You should consult your own tax, legal, and accounting advisors before engaging in any transaction. Content in this material is for general information only and not intended to provide specific advice or recommendations for any individual. To determine which strategies or investments may be suitable for you, consult the appropriate qualified professional prior to making a decision. Investing involves risk including possible loss of principal. Some of the information contained herein has been obtained from third party sources which are reasonably believed to be reliable, but we cannot guarantee its accuracy or completeness. The information should not be regarded as a complete analysis of the subjects discussed.
.png?width=290&name=Favicon%20SPW%20(1).png)