Fed Announcement Increases Probability of a Soft Landing
On December 13, 2023, the Federal Open Market Committee (FOMC) held its key interest rate steady, keeping the federal funds rate target range at 5.25% to 5.50%. This decision, which aligned with market expectations, reflects the Federal Reserve's response to evolving economic conditions. Notably, Fed Chair Jerome Powell's comments during the press conference suggested a more dovish tone than anticipated, hinting at an economy and labor market gradually moving toward equilibrium. The dovish tone combined with little adjustments to the growth forecast helped push the Dow Jones Industrial Average to a record high and the 10-year treasury yield below 4.00% for the first time since August 2023.
Two significant updates emerged from the Fed's statement. First, there was an acknowledgment of slowing economic growth and easing inflation—a scenario that aligns well with the previously anticipated economic trajectory. Second, the Fed subtly altered its language regarding future policy adjustments. By adding "any" to the phrase about determining the extent of any additional policy firming, the Fed indicated that, while the rate hike cycle might be nearing its end, the option for further increases remains on the table if deemed necessary.
The Road Ahead: Rate Cuts and Economic Projections
The Fed's outlook suggests potential rate cuts in 2024, though the timing and extent of these cuts are yet to be determined. The latest dot plot indicates that most participants expect the federal funds rate to end 2024 between 4.25% and 5.00%, with the median prediction reflecting a reduction to a range of 4.50% to 4.75%. This projection is 50 basis points below the September forecast, signaling a cautious but discernible shift in monetary policy (see chart below).
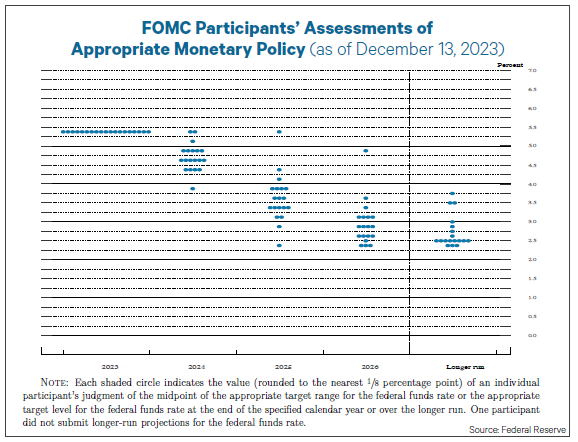
Inflation forecasts, particularly the PCE and core PCE, have been revised downward for 2023, with modest reductions expected in the following two years. This downward revision suggests that the Fed anticipates inflation to continue its decline, necessitating rate cuts to prevent real interest rates from climbing too high and inadvertently tightening monetary policy.
Contrastingly, the Fed's projections for GDP growth and the unemployment rate have remained relatively stable, with only a slight upward revision in GDP growth for the current year. This stability indicates that the overall economic outlook remains largely in line with previous expectations.
Together with the lower-than-expected CPI report last month, the Fed’s announcement increases the likelihood of a soft landing—a welcome bit of clarity for investors, who have been grappling with whether the Fed can pull off a soft landing. Recent events support the case that the tightening cycle is over, and that the higher-for-longer mantra may not be as long as previously feared.
Key Indicator Points to Favorable Relief of Excess Optimism
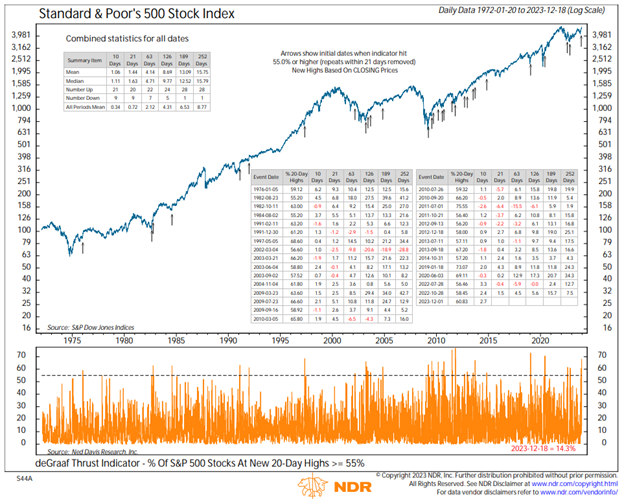
We previously noted that several oversold technical indicators had reversed higher, which is a good first step toward the end of the July – October correction. On an even more bullish note, multiple breadth thrust indicators—which are based on big, fast improvements in the advance/decline line—had fired in early November and into December.
Most recently, the percentage of S&P 500 stocks at new 20-day highs reached the highest level since the pandemic recovery, delivering a buy signal on December 1 (see chart below).
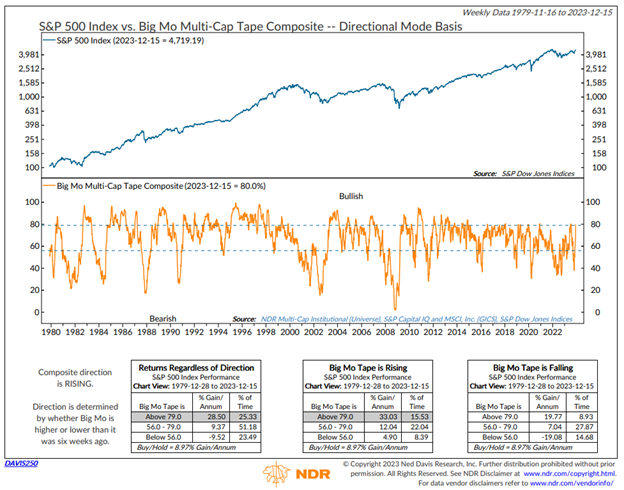
In addition to the improvement in short-term breadth thrust indicators, we have also seen major improvements in longer-term indicators. Ned Davis Research’s flagship indicator, the Big Mo Muti-Cap Tape Composite, measures the percentage of sub-industries in uptrends. On December 15, the indicator hit 80%, putting it back in the bullish zone and reaching one of the highest readings in the past decade (see chart below).
Stretched on a short-term basis
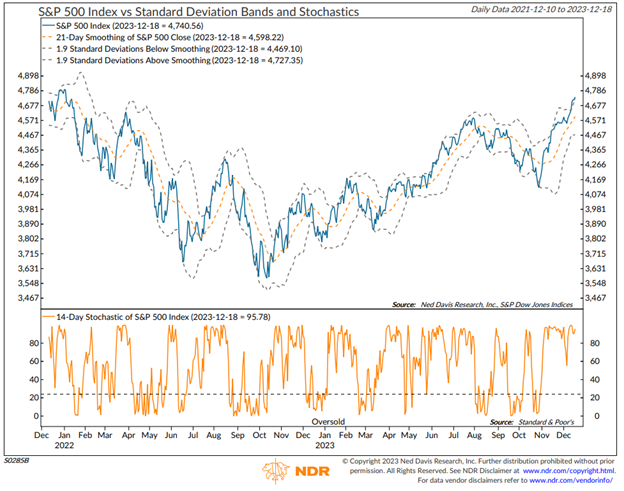
While the post-Fed rally has been powerful, it has also left the market overbought on a short-term basis, meaning it is trading at a level above its intrinsic or true value. This condition is often identified through technical analysis, using a variety of tools. The chart below shows that the S&P 500 is trading slightly above one such reading.
One of our key rules is, “Beware the crowd at extremes.” A crowd-related indicator is also flashing a bit of a warning sign as we have now moved well into excessive optimism, reaching one of the highest readings of 2023. As illustrated by the performance box in the lower right of the image below, the market typically struggles when the crowd reaches this level of optimism—hence, we call this a contrarian indicator.
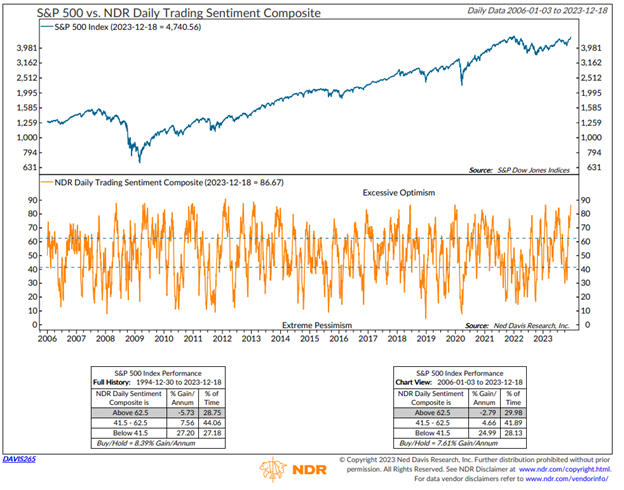
The risk of overbought and optimistic conditions is that they overstay their welcome and set the stage for what is called a “blow-off top.” This situation involves a steep, rapid increase in price and trading volume followed by a steep, rapid drop in price. While we don’t currently see a risk of a blow-off top, more appreciation on high volume could trigger those conditions.
So What’s Next?
The last two years have been all about the Fed’s fight against inflation, brought about by the massive liquidity injection following pandemic lockdowns. As things continue to normalize, we believe there is strong support for an environment where rates are more elevated than they have been following the financial crisis and a more “normalized” relationship between stocks, bonds, and other asset classes. It remains to be seen if the Fed’s fastest tightening cycle in history will push the economy into a recession in 2024 or if the Goldilocks soft landing scenario is achievable.
At Stratos Private Wealth, we remain focused on a combination of objective strategies and a wide range of investment solutions to help our clients weather any potential storms ahead.
Stratos Private Wealth is a division through which Stratos Wealth Partners, Ltd. markets wealth management services. Investment advisory services offered through Stratos Wealth Partners, Ltd., a registered investment adviser. Stratos Wealth Partners and its affiliates do not provide tax, legal, or accounting advice. This material has been prepared for informational purposes only; and is not intended to provide, and should not be relied on for, tax, legal, or accounting advice. You should consult your own tax, legal, and accounting advisors before engaging in any transaction. Content in this material is for general information only and not intended to provide specific advice or recommendations for any individual. To determine which strategies or investments may be suitable for you, consult the appropriate qualified professional prior to making a decision. Investing involves risk including possible loss of principal. Some of the information contained herein has been obtained from third party sources which are reasonably believed to be reliable, but we cannot guarantee its accuracy or completeness. The information should not be regarded as a complete analysis of the subjects discussed.

%20(3).png?width=300&name=Individuals%20%20header%20(2000%20%C3%97%201260%20px)%20(3).png)
