

Time to Read: 5 Minutes
Last month, Stratos Private Wealth hosted a webinar titled “Is the Recession Over?” where we examined what appeared to be signs of a bottom in economic activity and the implications for markets and the economy in a COVID-19 world.
The National Bureau of Economic Research (NBER) is a private, non-profit, non-partisan organization dedicated to conducting economic research and is the organization responsible for calling the beginning and end of official recessions in the U.S. According to NBER, “A recession begins when the economy reaches a peak of activity and ends when the economy reaches its trough. Between trough and peak, the economy is in an expansion. Expansion is the normal state of the economy; most recessions are brief. However, the time that it takes for the economy to return to its previous peak level of activity or its previous trend path may be quite extended. According to the NBER chronology, the most recent peak occurred in February 2020, ending a record-long expansion that began in June 2009, and inaugurating a recession.”
Using the group’s definition, the recession will be over once the economy reaches its trough. At Stratos Private Wealth, we believe this has occurred—or is occurring in real time—based on several indicators we track closely, four of which we explore here.
Indicator #1: Citigroup U.S. Economic Surprise Index points to an abrupt upturn
The Citigroup U.S. Economic Surprise Index measures how much data from the past three months has beaten or missed the median estimates from Bloomberg surveys. As shown below, the index fell off a cliff in early 2020, indicating massive downside surprises due to the rapid spread of COVID-19 and the resulting lockdowns. In late June, however, the index hit a record high, signaling an abrupt upturn in the economy versus analyst expectations.

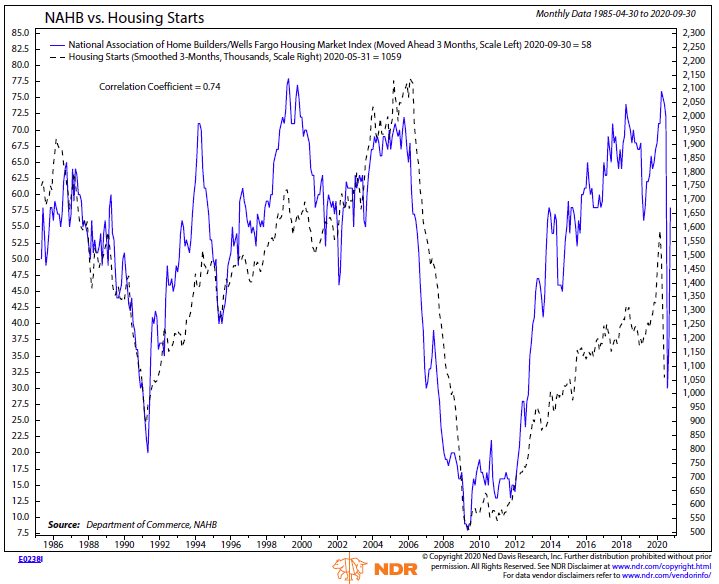
Indicator #2: NAHB/Wells Fargo Housing Market Index rising at record pace
The housing market is also considered a very good leading indicator for the economy. The NAHB/Wells Fargo Housing Market Index, shown below, has risen at the fastest rate in its history after bottoming out in mid-March. This should bode well for housing starts and all housing-related industries, which play an important role in the overall U.S. economy.
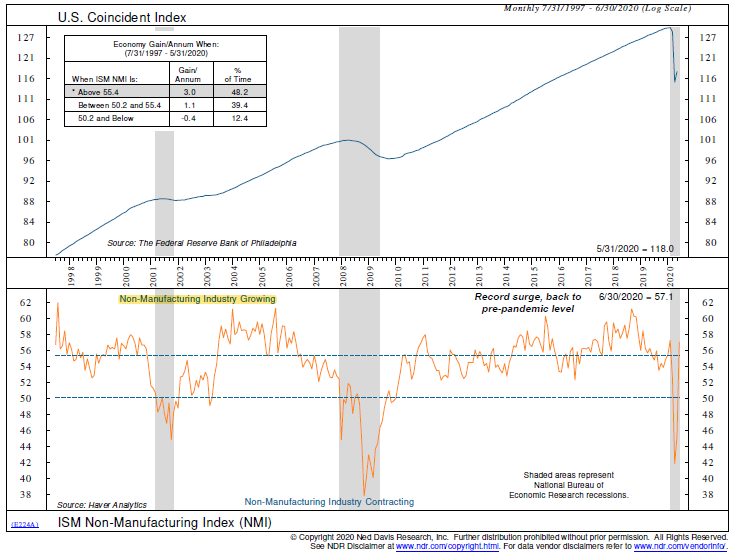
Indicator #3: ISM Non-Manufacturing Index shows rebounding services sector
We have also witnessed a massive turnaround in the services sector of the economy, as evidenced by recent moves in the ISM Non-Manufacturing Index. The index reflects surveys of more than 40,000 non-manufacturing firms’ purchasing and supply executives. It surged a record 11.7 points in June to 57.1, as shown below, well above the consensus estimate of 50.1. This was the highest level since February, before the shutdown of the economy in response to COVID-19. The ISM Manufacturing Index is also bouncing back. Together, these indexes point to a rebound in economic activity and indicate that the recession likely ended in Q2 as both measures are now showing an expansion.
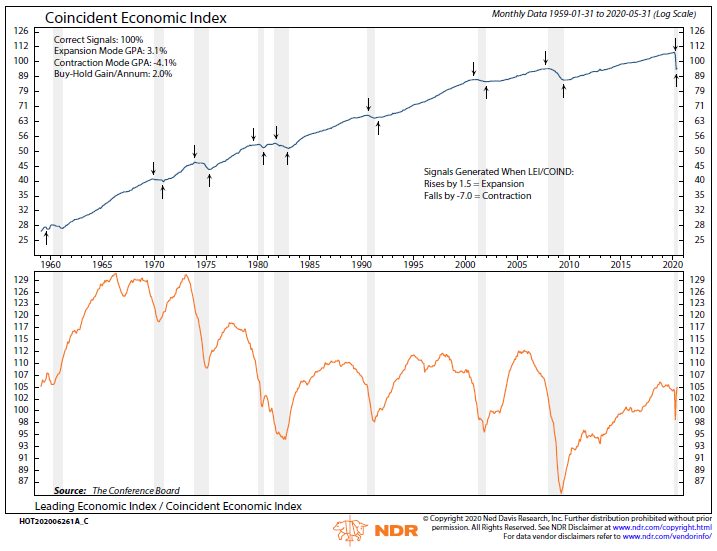
Indicator #4: Ned Davis Research indicator flashing “buy” signal
Finally, I would like to highlight one indicator from Ned Davis Research that has a great record. The chart below shows the ratio of leading economic indicators (forward-looking) to coincident indicators (current situation). When this ratio falls abruptly, it shows a “sell” signal designed to predict a contraction in economic activity or a recession. When it rises dramatically, which indicates forward-looking economic numbers are exceeding current numbers, it shows a “buy” signal to mark the end of a recession. Official recessions are marked in the chart with grey shading.
A review of the chart reveals that the buy and sell signals have correctly called 100% of recessions and beginnings of expansions. You can also see that the indicator gave a buy signal in April and improved further in May. If true, this would make the 2020 recession the shortest on record.
Massive fiscal and monetary stimulus curbed the downside of this recession. That said, we want to temper expectations for a V-shaped recovery, as the resurgence of the virus has caused many states to delay or reverse their reopening plans while others have imposed travel restrictions on visitors from states where cases have spiked. It is the unpredictable nature of this pandemic that has kept us from becoming overly aggressive with our equity holdings after moving to neutral from underweight in late March.
As shown below, the upward path of equities after the end of a recession has historically included some pullbacks. We believe investors who are still underweight stocks should use such pullbacks as an opportunity to add to equity exposures as the economy continues to work through its recovery.

Stratos Private Wealth is a division through which Stratos Wealth Partners, Ltd. markets wealth management services. Investment advisory services offered through Stratos Wealth Partners, Ltd., a registered investment adviser. Stratos Wealth Partners and its affiliates do not provide tax, legal, or accounting advice. This material has been prepared for informational purposes only; and is not intended to provide, and should not be relied on for, tax, legal, or accounting advice. You should consult your own tax, legal, and accounting advisors before engaging in any transaction. Content in this material is for general information only and not intended to provide specific advice or recommendations for any individual. To determine which strategies or investments may be suitable for you, consult the appropriate qualified professional prior to making a decision. Investing involves risk including possible loss of principal. Some of the information contained herein has been obtained from third party sources which are reasonably believed to be reliable, but we cannot guarantee its accuracy or completeness. The information should not be regarded as a complete analysis of the subjects discussed.
.png?width=290&name=Favicon%20SPW%20(1).png)