Time to read: 7 minutes |
On July 11th, 2018, we wrote about the “tug of war” between strong domestic economic news and potential for interest rate hikes, domestic policy mistakes, and increased risks for international equity markets. We argued it was no longer prudent to own stocks in excess of our benchmarks. Accordingly, equity exposure in client portfolios was cut from “overweight” to “neutral”.
On November 2nd, 2018, we followed suit and further reduced risk in client portfolios to “underweight”, as the bear case strengthened and many of July’s concerns materialized. A brief relief rally after October’s volatility allowed us to make additional stock cuts into short-term market strength. 40% of Ned Davis Research’s Bear Watch composite indicators had been triggered. This approached, but did not cross, our threshold for considering even larger cuts to stock exposure.
Now we’re in the process of additional modest cuts to equity exposure. 50% of the indicators composing NDR’s Bear Watch report have triggered, crossing our threshold for full defensive measures. Although we entered December already underweight stocks, Ned Davis’s Risk-On/Risk-Off indicator has bolstered the case for incremental equity reductions.
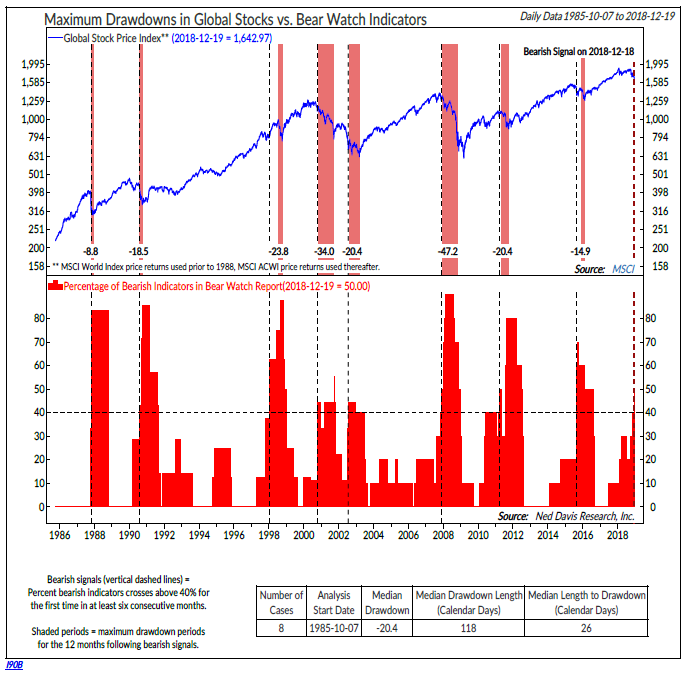
The chart below shows there have been eight cases when over 40% of the Bear Watch indicators have triggered. The bottom clip of the chart shows the percentage of bearish indicators in red over time. Dotted vertical lines denote the dates when this composite exceeded 40%. The top clip of the chart shows global stock market prices with dotted vertical lines marking the dates when the Bear Watch first exceeded 40%. Of these eight cases, a median decline of -20.4% has followed, beginning within one month and lasting roughly four months.
 Of particular interest is NDR’s global stock/bond ratio, which is responsible for tipping the Bear Watch composite above 40% bearish signals. When the stock/bond ratio drops more than 10% below its 200-day moving average (chart below) – it indicates a rapid change in relative strength between global equities and bonds. Coincidentally there have also been eight previous cases in which this indicator has triggered since 1981 when tracking began. The median decline in the global stock benchmark which followed was -13.7% during the next 12 months.
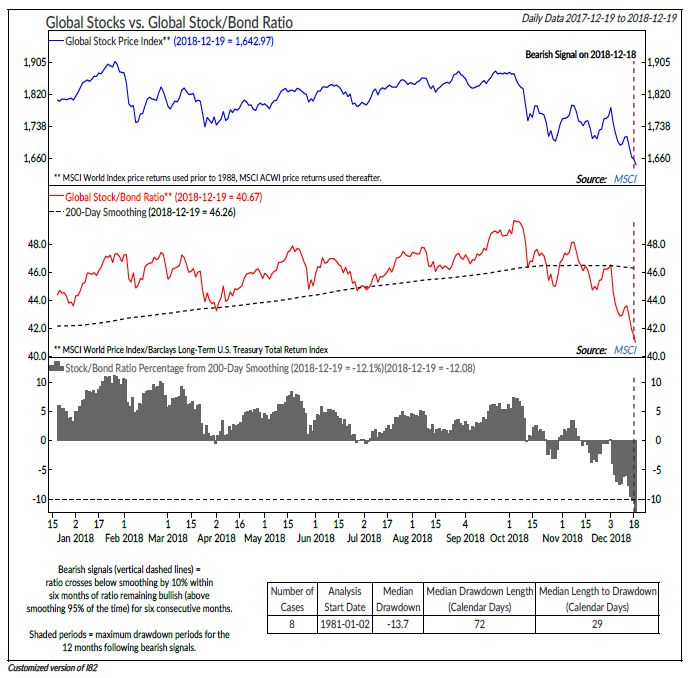
Now What? Although we still view a domestic recession in the near-term as unlikely, markets lead economic data by months so recession is possible. Portfolios will be better positioned for this possibility after our most recent trades. Recent action has been partially driven by shorter-term catalysts related to the news cycle: Fed statements, trade disputes, discussion of government shutdown, etc. We think it’s more likely that favorable news on any of these fronts, in conjunction with economic news supporting the “no domestic recession case”, could accelerate the bottoming process. If this happens, we expect to act more quickly than usual to add equities across client portfolios.
The economic forecasts set forth in this material may not develop as predicted and there can be no guarantee that strategies promoted will be successful. All indices are unmanaged index which cannot be invested into directly. Past performance is no guarantee of future results.